
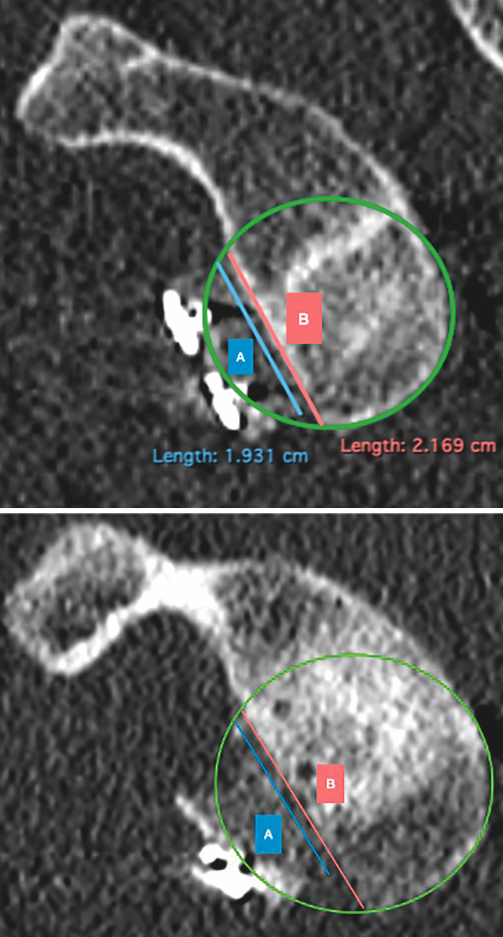
Figure 2. Evaluation of graft positioning in the sagittal section. Two lines are traced of a length equivalent to the size of the glenoid bone defect (B) and to the length of the graft covering the defect (A). Image A shows how most of the bone defect is covered by the graft - the latter therefore being considered to be well positioned. Image B shows that less than 90% of the bone defect is covered by the graft - the latter therefore being considered to be inadequately positioned.